
Most project reports are written as a record of the month. The useful ones, however, are written as an instrument for the next decision: they start from the decision the reader has to make, and work backwards to the evidence that supports it.
The reporting week is familiar enough to become invisible. The data date passes. Someone chases updated programmes, refreshes the charts, collects discipline commentary and fills in the cover page. By the time the pack reaches the sponsor, everyone can see that a milestone has moved. Nobody can tell whether the movement came from a late design release, a productivity problem, a changed sequence or a date that was never achievable. The meeting spends its first half reconstructing the story that the report should already have told.
A decision-ready project report says what changed, why it changed, what that change now affects, how certain the team is, and what it needs the reader to decide or do. The tables and charts are evidence for that argument. They are not the argument itself.
A dashboard describes a condition; a project report must explain its consequence
A dashboard is good at answering questions with stable definitions: how many activities are complete, whether the forecast finish moved, whether a risk is open. It is usually the fastest way to see a trend. It is not, by itself, a report.
The missing work is interpretation. Consider a milestone that has slipped ten working days since the last period. A dashboard can show the variance precisely. A useful report must answer four separate questions:
- Has the driving predecessor genuinely finished late?
- Did a change to the logic or calendar recalculate the date?
- Is a constraint or target date masking the forecast position?
- Do we know the operational impact of the updated schedule yet?
More than one of these can be live at once, and each points at a different response: recovery action, a check of the revised plan, an honest forecast, or a decision on whether the evidence is good enough to commit.
Putting all four behind a red status does not simplify the decision. It moves the analytical work into the meeting, where it is slower, less prepared and harder to audit later.
Start a project report with the decision, then select the evidence
The usual reporting workflow starts with the available inputs. Someone exports the schedule, copies last month's risk register, adds progress charts, asks each discipline for a paragraph, then tries to make the pack cohere before the deadline.
That order is backwards because it treats the report as a container for information. Start with the decisions instead. For every material section, ask: who needs to decide what after reading this?
For a completion-date forecast, the decision may be whether to approve a recovery plan, accept a revised contractual position, or fund an acceleration option. For a procurement risk, it may be whether to release a package, escalate a supplier issue or accept the exposure. For a plan on a page, it may simply be whether the delivery sequence still makes operational sense.
Once that decision is clear, the required evidence becomes much smaller and much sharper. A completion-date section needs the forecast delta, the driving chain, the cause, the remaining uncertainty and the available response. It does not need every activity that happened to be red in the programme.
This is also how one schedule can properly support several reports. A board needs the decision and the exposure. A supplier needs the workfront, interface and commitment that affect them. The delivery team needs enough detail to act tomorrow morning. The underlying schedule is the same; the audiences and the decisions they need are different.
Every material statement needs a visible basis
The hardest part of reporting is rarely writing the sentence. It is being able to defend it.
"The completion date is at risk" is not useful until the reader can ask: compared with what? Which schedule version? Which data date? What changed in the network? Is the risk based on an accepted update, a field report, a supplier notice or an assumption that has not yet been tested? Even the accepted update deserves that scrutiny: a clean-looking status can sit on untrustworthy actuals.
This is where many reporting packs fail quietly. They turn a chain of partial evidence into a fluent paragraph, then sever the paragraph from its source. By the next reporting cycle, nobody can tell whether the claim was a forecast, a commitment, a working assumption or a sentence copied from the previous month.
A good report preserves that distinction. It names the comparison point. It labels an estimate as an estimate. It says when a record is missing. It links a material statement to the schedule activity, instruction, meeting record, drawing or risk that supports it. A reader should be able to move from "the date moved" to "here is the change in the programme, here is the evidence for the cause, and here is the person who owns the next action."
That traceability matters even when everyone in the room agrees. Projects run long enough for people, systems and memories to change. The report becomes part of the project record, and the record is only as useful as the basis kept behind it. A confident sentence without its basis is fragile evidence.
Reporting rules are judgment calls, not schedule calculations
Our own data makes the point plainly. In one 30-day window, one customer team ran roughly 110 reporting conversations with Planlab's AI agents. In about 50 of them, the agent had to stop mid-task and ask the user a live question, sometimes more than once. Not one of those questions was about calculation. They were about what the report meant: which activities counted as construction, which baseline to compare against, or the basic project details the report needed.
The pattern is unsurprising to anyone who has built a monthly pack. The scheduling tool can calculate dates. It cannot decide, on its own, whether a milestone belongs in an operational view, whether a revised programme supersedes the agreed baseline, or whether a missing instruction should be treated as a risk, an issue or a change.
Those questions are not a reason to abandon automation. They identify where judgment belongs. A reporting process should settle them explicitly once (what is in scope, what the period is compared against, which revision and data date the report speaks for), retain the answers as the reporting standard, and reuse them next period. Otherwise the team rediscovers its own reporting standard every month.
The agent does the legwork; your team owns the decision
This is a useful boundary for AI in project reporting. An agent can read the latest schedule, compare versions, check a period, draft a narrative, prepare charts, apply a client template and produce a PDF. It can also flag an inconsistency that a tired team might miss: a changed completion date with no identified driver, a narrative that still refers to last period's data date, or a risk presented as a confirmed fact.
But the agent should not invent the reporting scope, decide that a forecast is acceptable, or convert poor records into artificial certainty. When the basis is unclear, the right output is a focused question or an explicit qualification: a good agent stops and flags the gap rather than burying it under polished prose.
Planlab is built around that division of work. It can turn schedule data into plain-English progress summaries, risks and next steps in the format a stakeholder needs. Our AI agents keep the route from source, through analysis, to decision visible while they do the repetitive assembly work.
Here is what that looks like in practice:
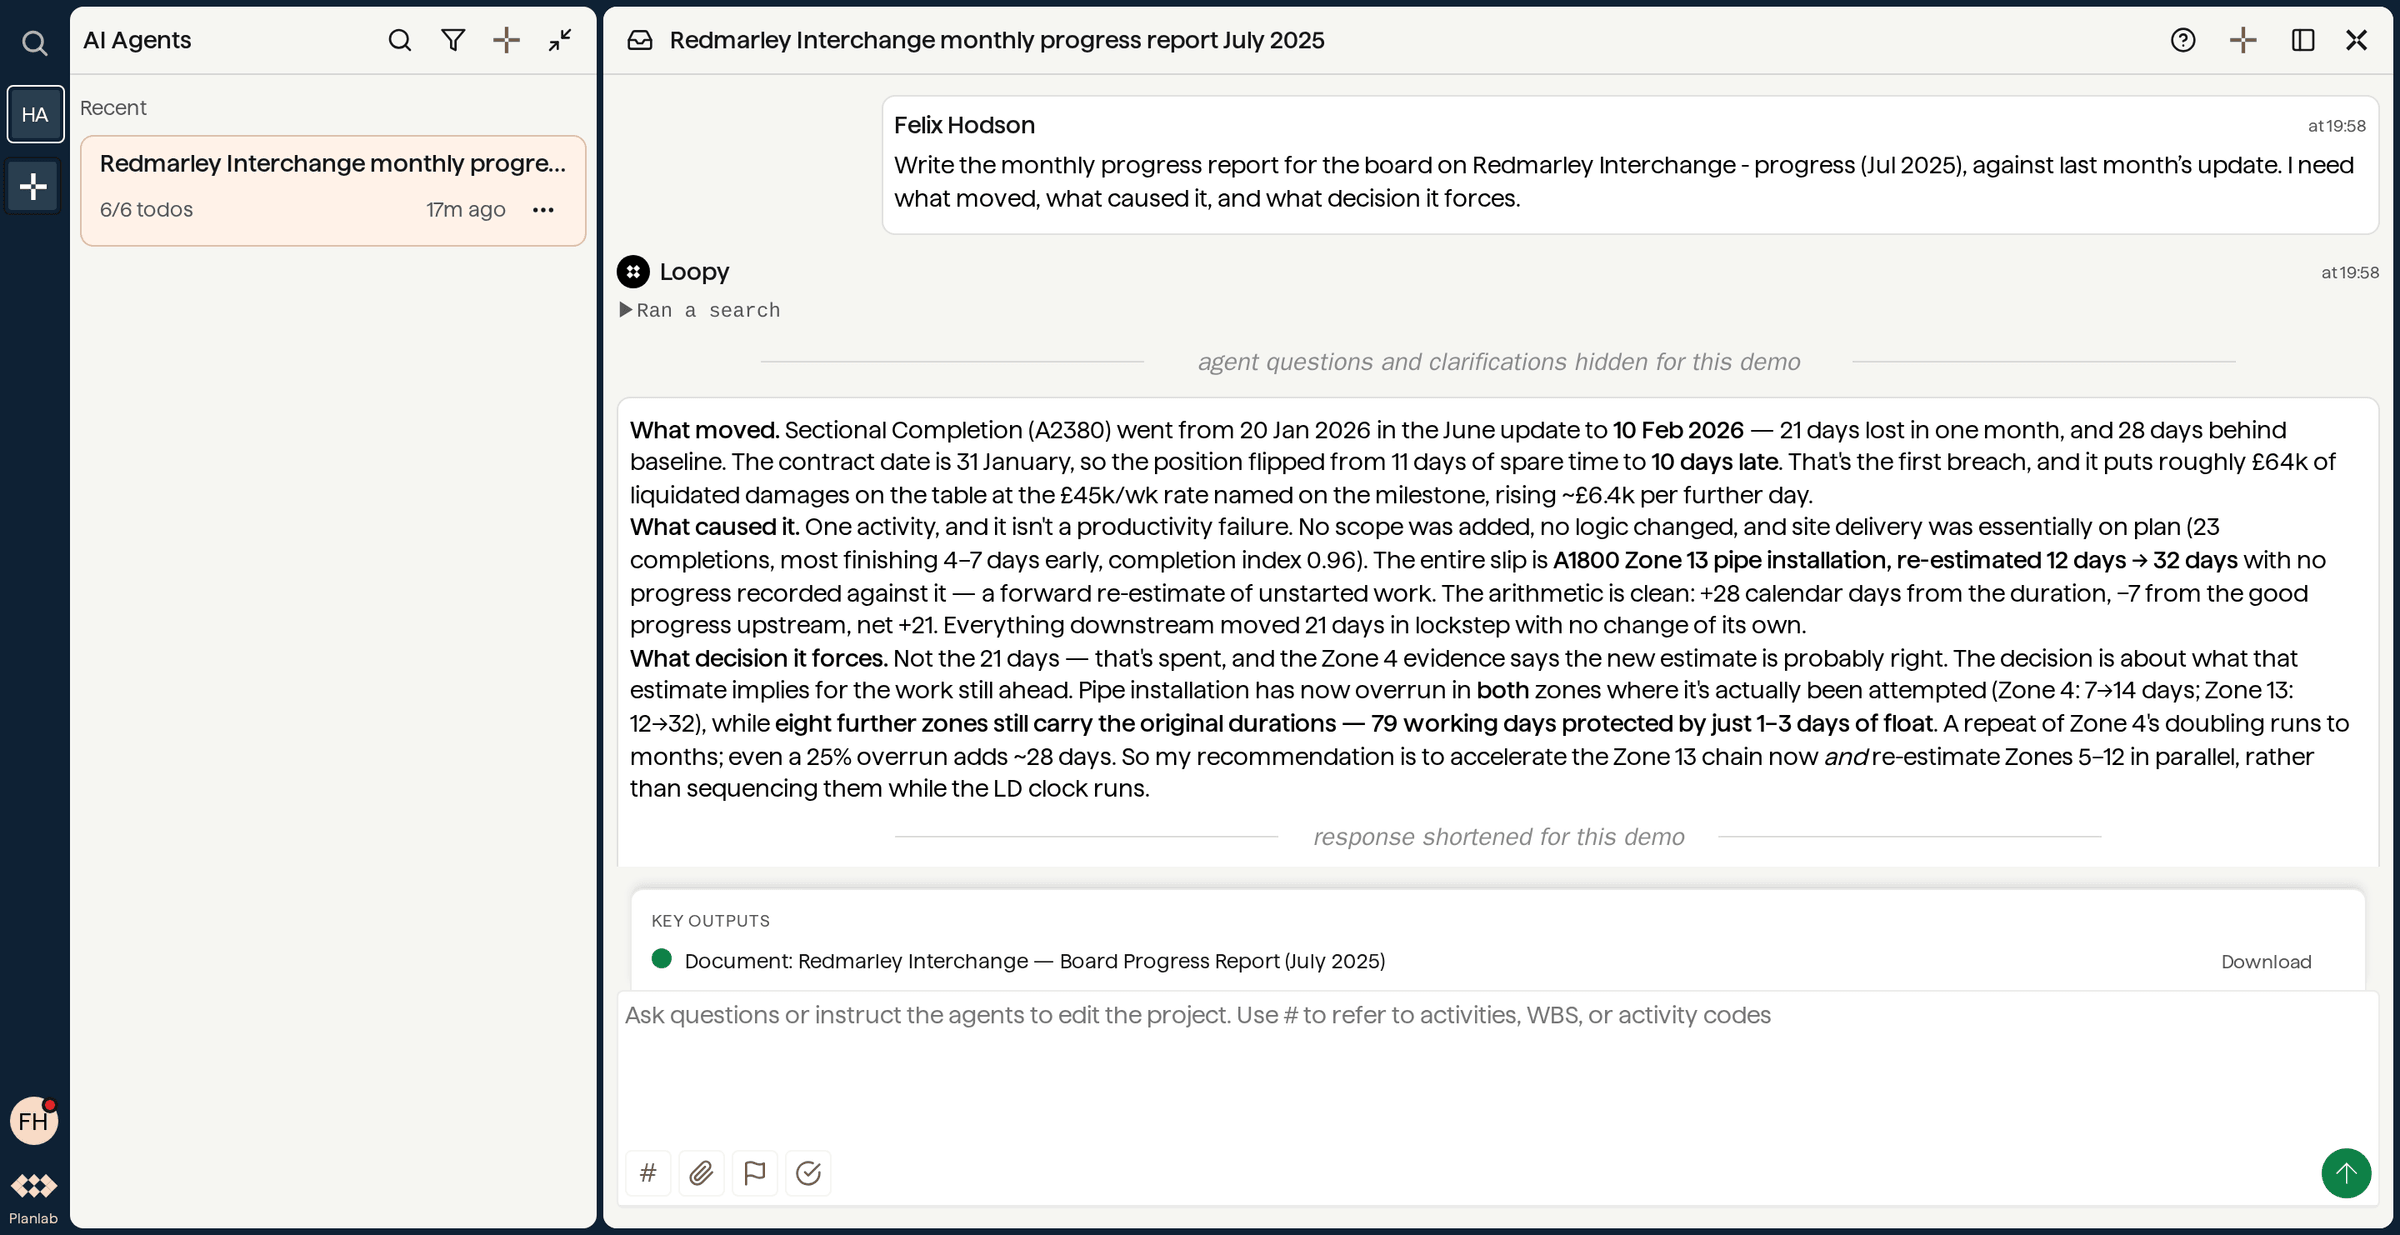
A monthly board report drafted by a Planlab agent from one sentence. The answer follows the request exactly: what moved, what caused it, and what decision it forces, with the breach of the contract date priced and the decision left with the reader. Illustrative workspace with fictional schedules; the conversation is shortened where marked.
Write the next project report from the decision backwards
Before the next reporting cycle, take one material section of the pack and try a different sequence:
- Write the decision or action the reader should be able to take after reading it.
- State the change in one sentence, including the comparison point.
- Add the cause and the consequence, separating fact from estimate.
- Link the material claims to their basis.
- Remove every chart, table and paragraph that does not help the reader understand or make that decision.
The result may be shorter. It should certainly be clearer. More importantly, it gives the project team a report that can be used to steer the work, rather than a record of why the steering meeting took so long.
About the data
The figures come from a 30-day review (13 July to 11 August 2026) of one customer team's conversations with Planlab's agents, anonymised. A conversation counted if it was about producing a report: creating one, exporting one, or working on a named report or dashboard. About 110 of the roughly 200 conversations qualified, and the questions were classified by reading them. The screenshot is from a demonstration workspace built for this post: the schedules and the project are fictional, and the conversation is shown shortened where the notes in the image say so.
Related reading
- Assurance Was Always a Capacity Problem: why the review work that sits behind a reliable report is so often deferred.
- Auto Progress Updates, Done Right: why a clean-looking status can still be built on untrustworthy underlying data.
- Your Project Needs a Knowledge Base: why a project needs the basis behind its information, not just a document store.