How I Learned to Stop Worrying and Open that XER with 1 Million Rows

At Planlab, we love optimisation. We optimise schedules to save money and resources, but we also optimise presentation of schedules to save confusion and stress.
Our schedule editor is designed to work on schedules with up to 10,000 rows or so. For most clients, that is more than enough. But for our clients with schedules of multiple tens of thousands of rows, it's getting painful as they may have to wait many seconds to see their schedule or make any change.
We are building the next generation of our schedule editor to handle really big schedules. In fact, we optmised the editor to handle XERs with 1,000,000 rows of data. Here are the synthetic XERs we generated for performance profiling: 1M.xer has 1 million activities and 2,221 WBS items; 350K.xer contains 350 thousand activities and 682 thousand dependencies, 250 activity codes, 100 calendars, and 100 resources.
And here are screen recordings of our next generation of schedule editor, in a local development environment, opening these two files (real time, no edits!):
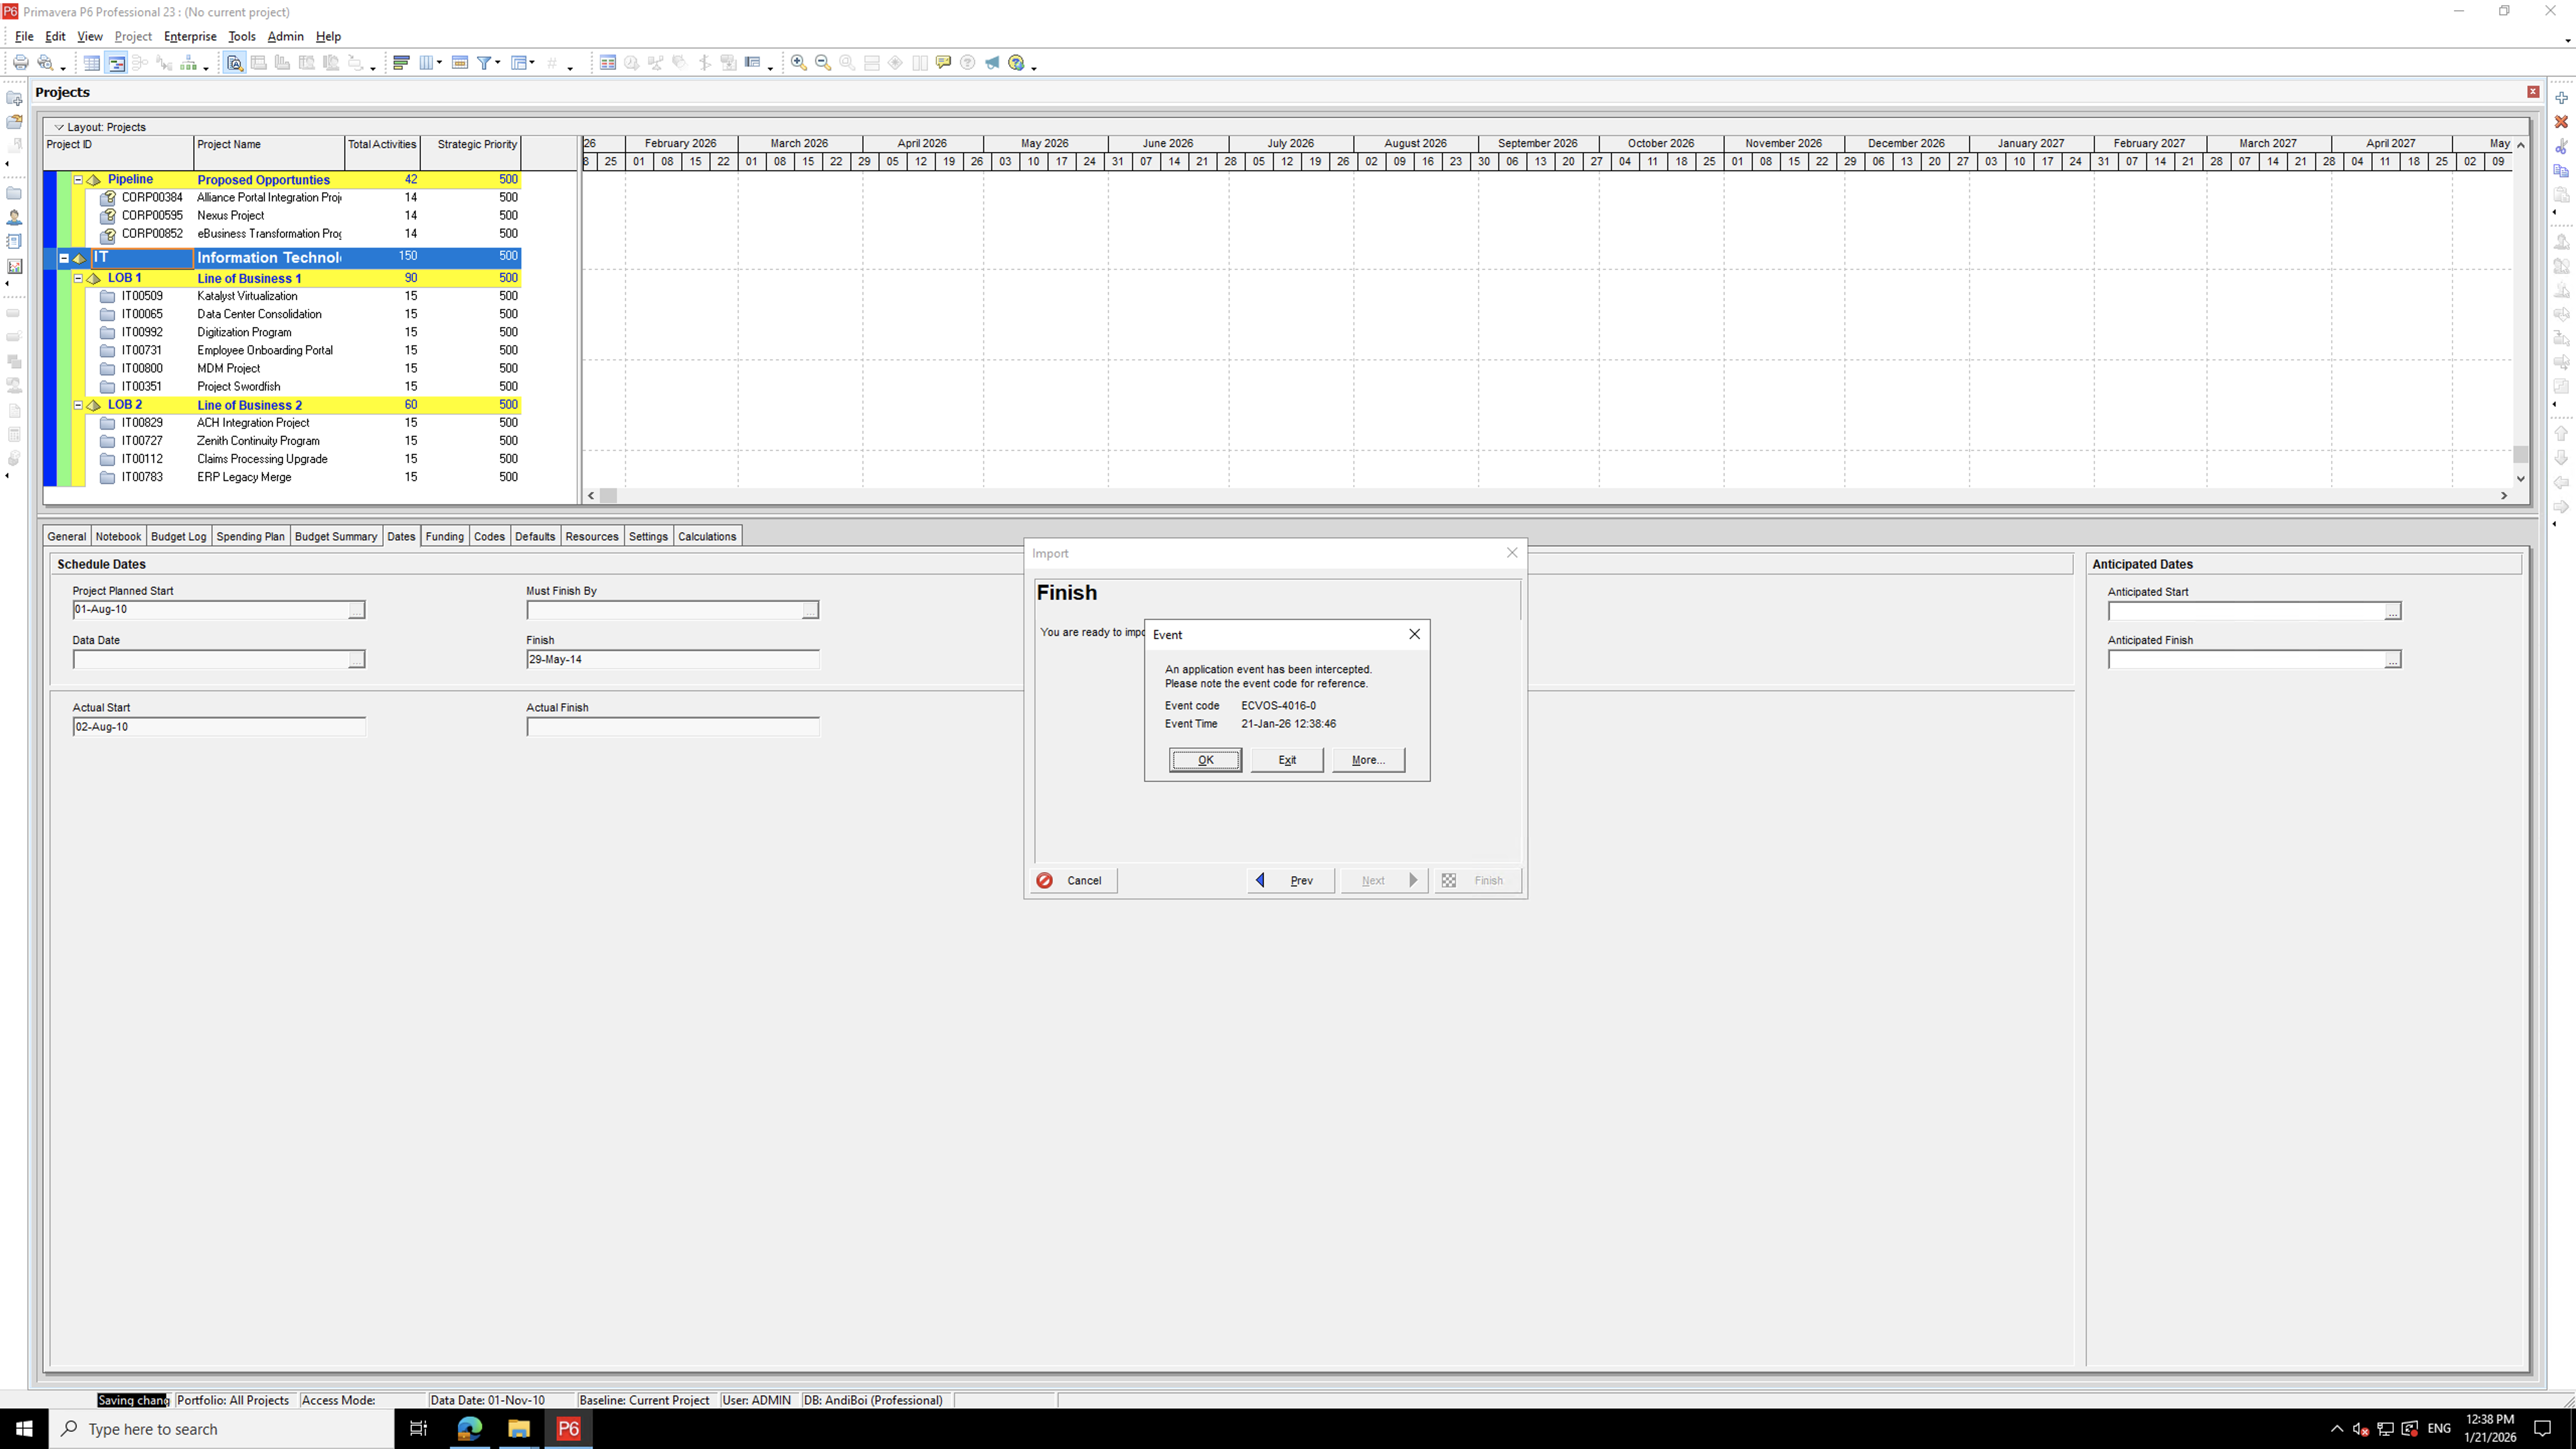
Try these files with your favourite schedule viewer or editor! We tried to import them to Oracle Primavera P6 Professional but unfortunately it failed to import either schedule during our tests.
The Evolution of Our Schedule Viewer Component
A table of activities paired with a Gantt chart is an old concept, but making this concept fast and useful in the web platform, accessible to anyone with a browser without installation, is not trivial. We have undergone five generations of our schedule viewer/editor component.
Generation 1: The "ScheduleViewer"
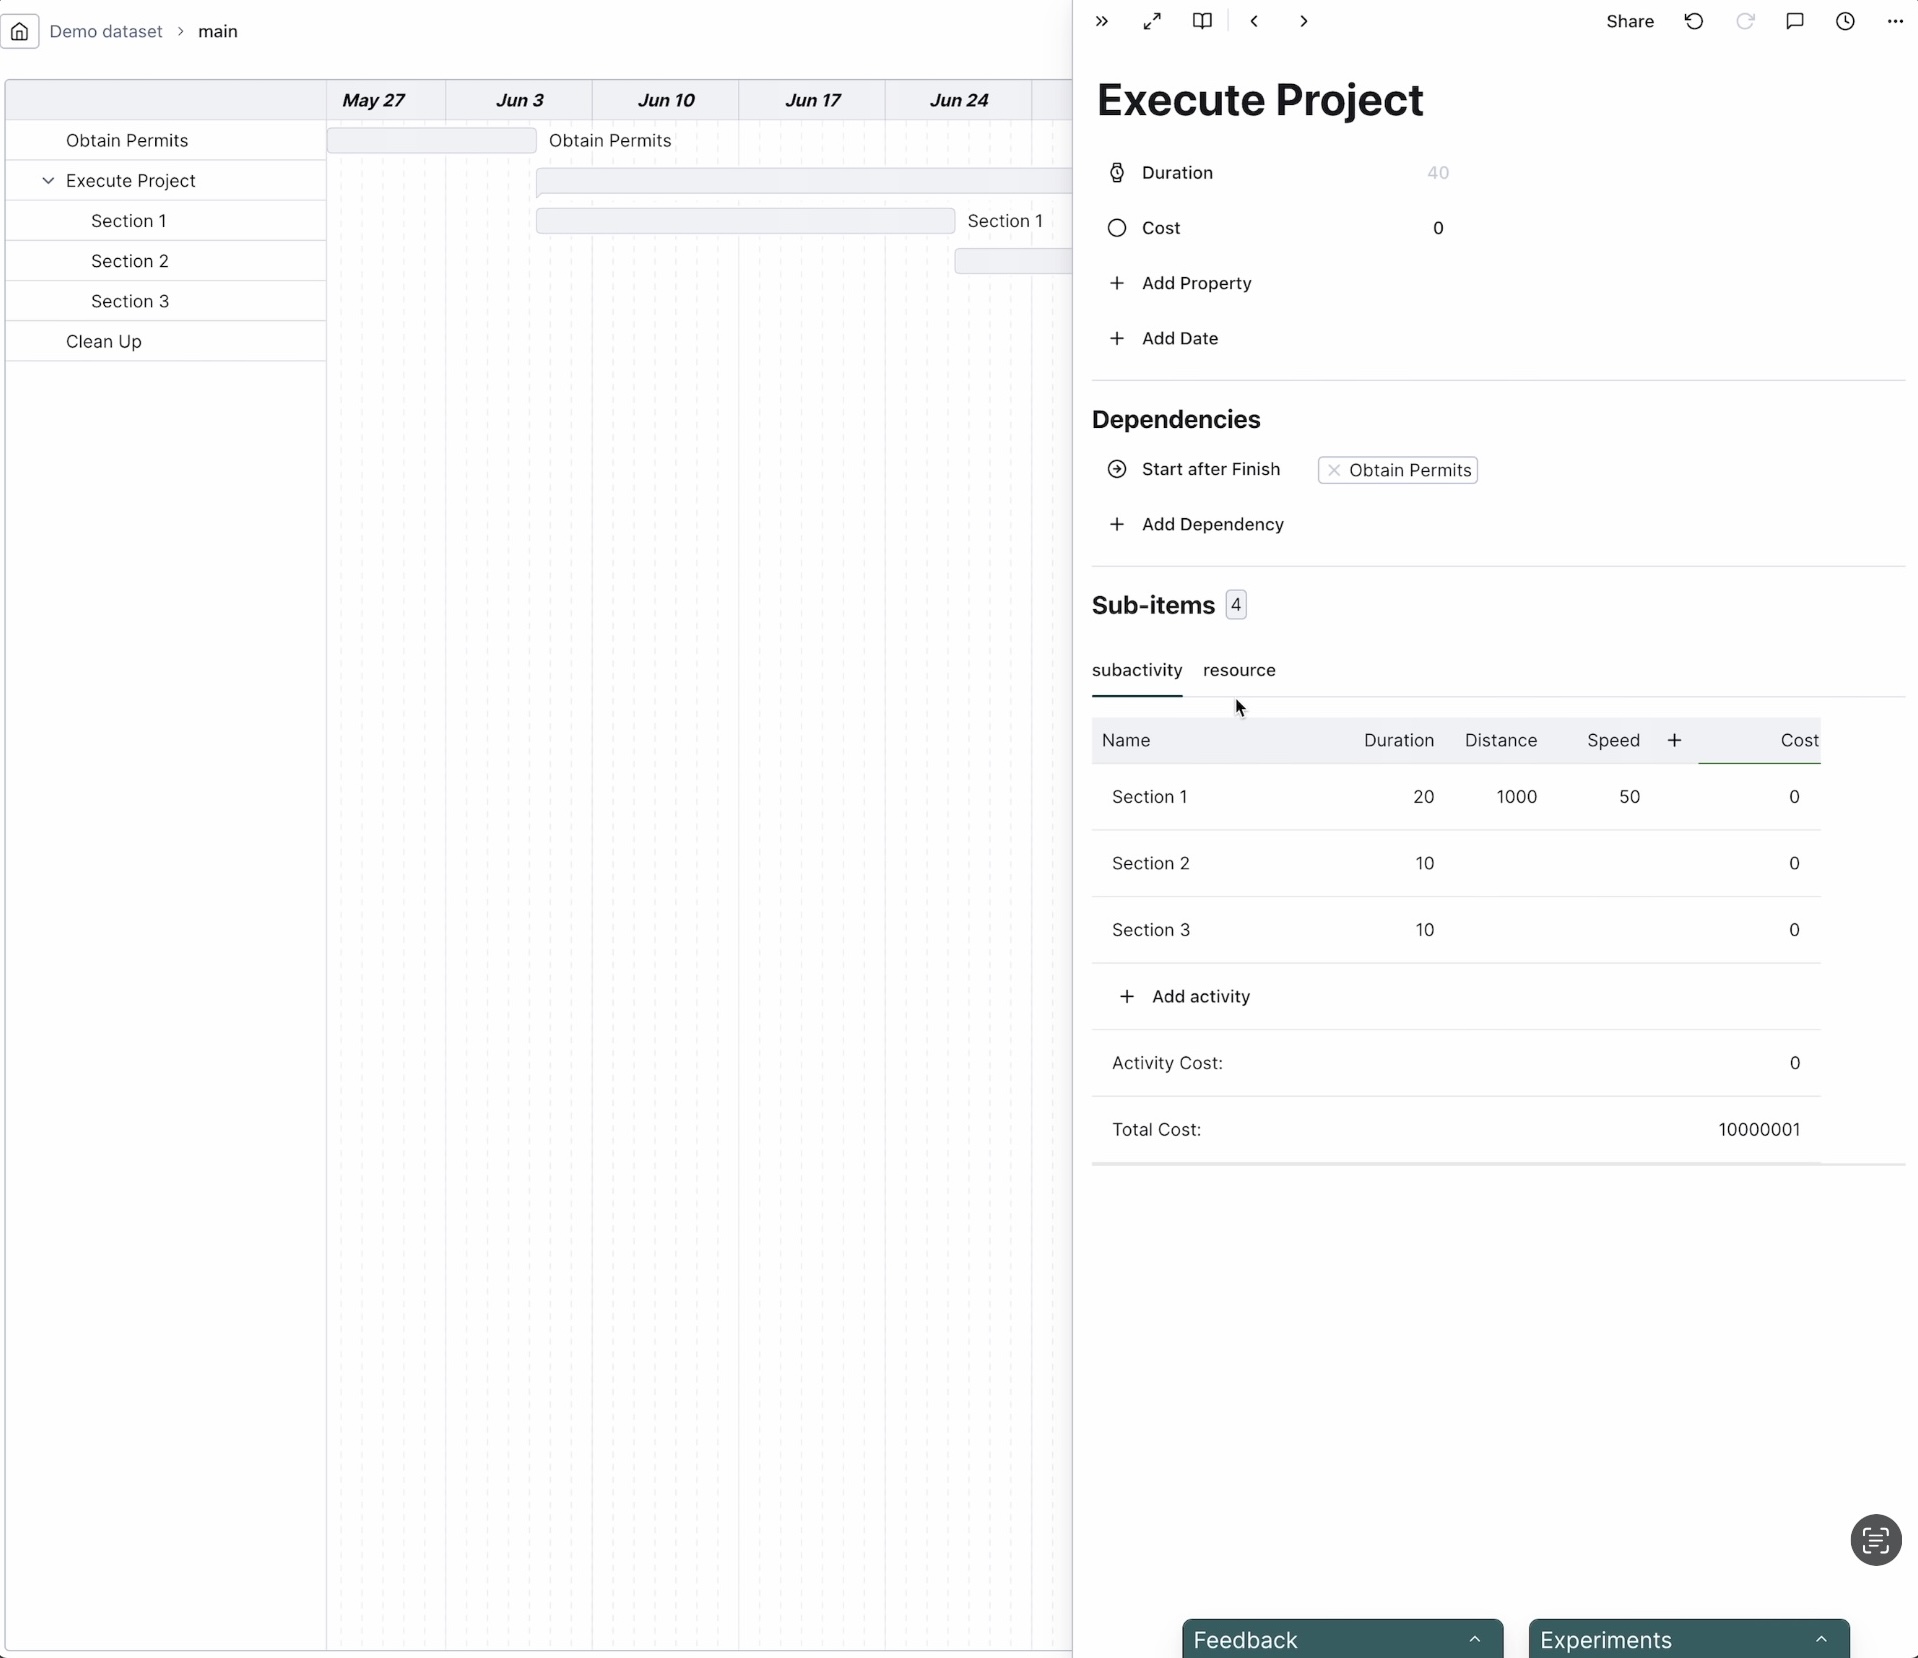
Our earliest users would recognise it. Back then, we thought each activity should have its own set of properties, to allow for maximal expressiveness. You can say "this digging activity digs X km at a unit cost of Y GBP/km, and its cost is X * Y, but that permitting activity's cost is determined by number of permits necessary".
Natural to this conceptualisation, you don't edit fields in a table (because columns are different for activities), you edit fields of an activity individually, in a pop-up on the side.
This version was retired because our clients don't model their projects this way.
Generation 2: DHTMLX Gantt
While we were reverting to a more traditional model of schedules, we tried a more traditional schedule viewer component, DHTMLX Gantt Chart, a rather mature project that goes back to at least 2010. In less than a month we got rid of it, because while it looked plausible on a toy project, the moment you used it for real-world projects with real-world feature requests, it's either slow, restrictive, or awkward to extend.
Generation 3: BarChartTable
After dropping DHTMLX, we started to build the third generation of our schedule viewer, a group of components labelled "BarChartTable". Initially it had been read-only but over time gained more and more edit capabilities. It introduced windowing (rendering only the visible rows) which later generations inherited.
Visually and functionally, BarChartTable was not much different from the next generations but it was built with a different design philosophy. It was designed to render a table of arbitrary data, each with arbitrary cell content and arbitrary event handling (user clicking etc.). The caller not only supplies the schedule data but also components to render the cells with. To support such flexibility, it needs four layers of components, each accepting 20-30 props, some of which functions. Then several dozens of useEffect and useMemo calls compute the final data to pass to the render functions.
This design makes it very hard for React to prevent unnecessary re-rendering when anything changes (e.g. when user clicks anything), or for a human to diagnose what caused a re-rendering, as data travels down 4 layers of components then travels all the way back to the render functions.
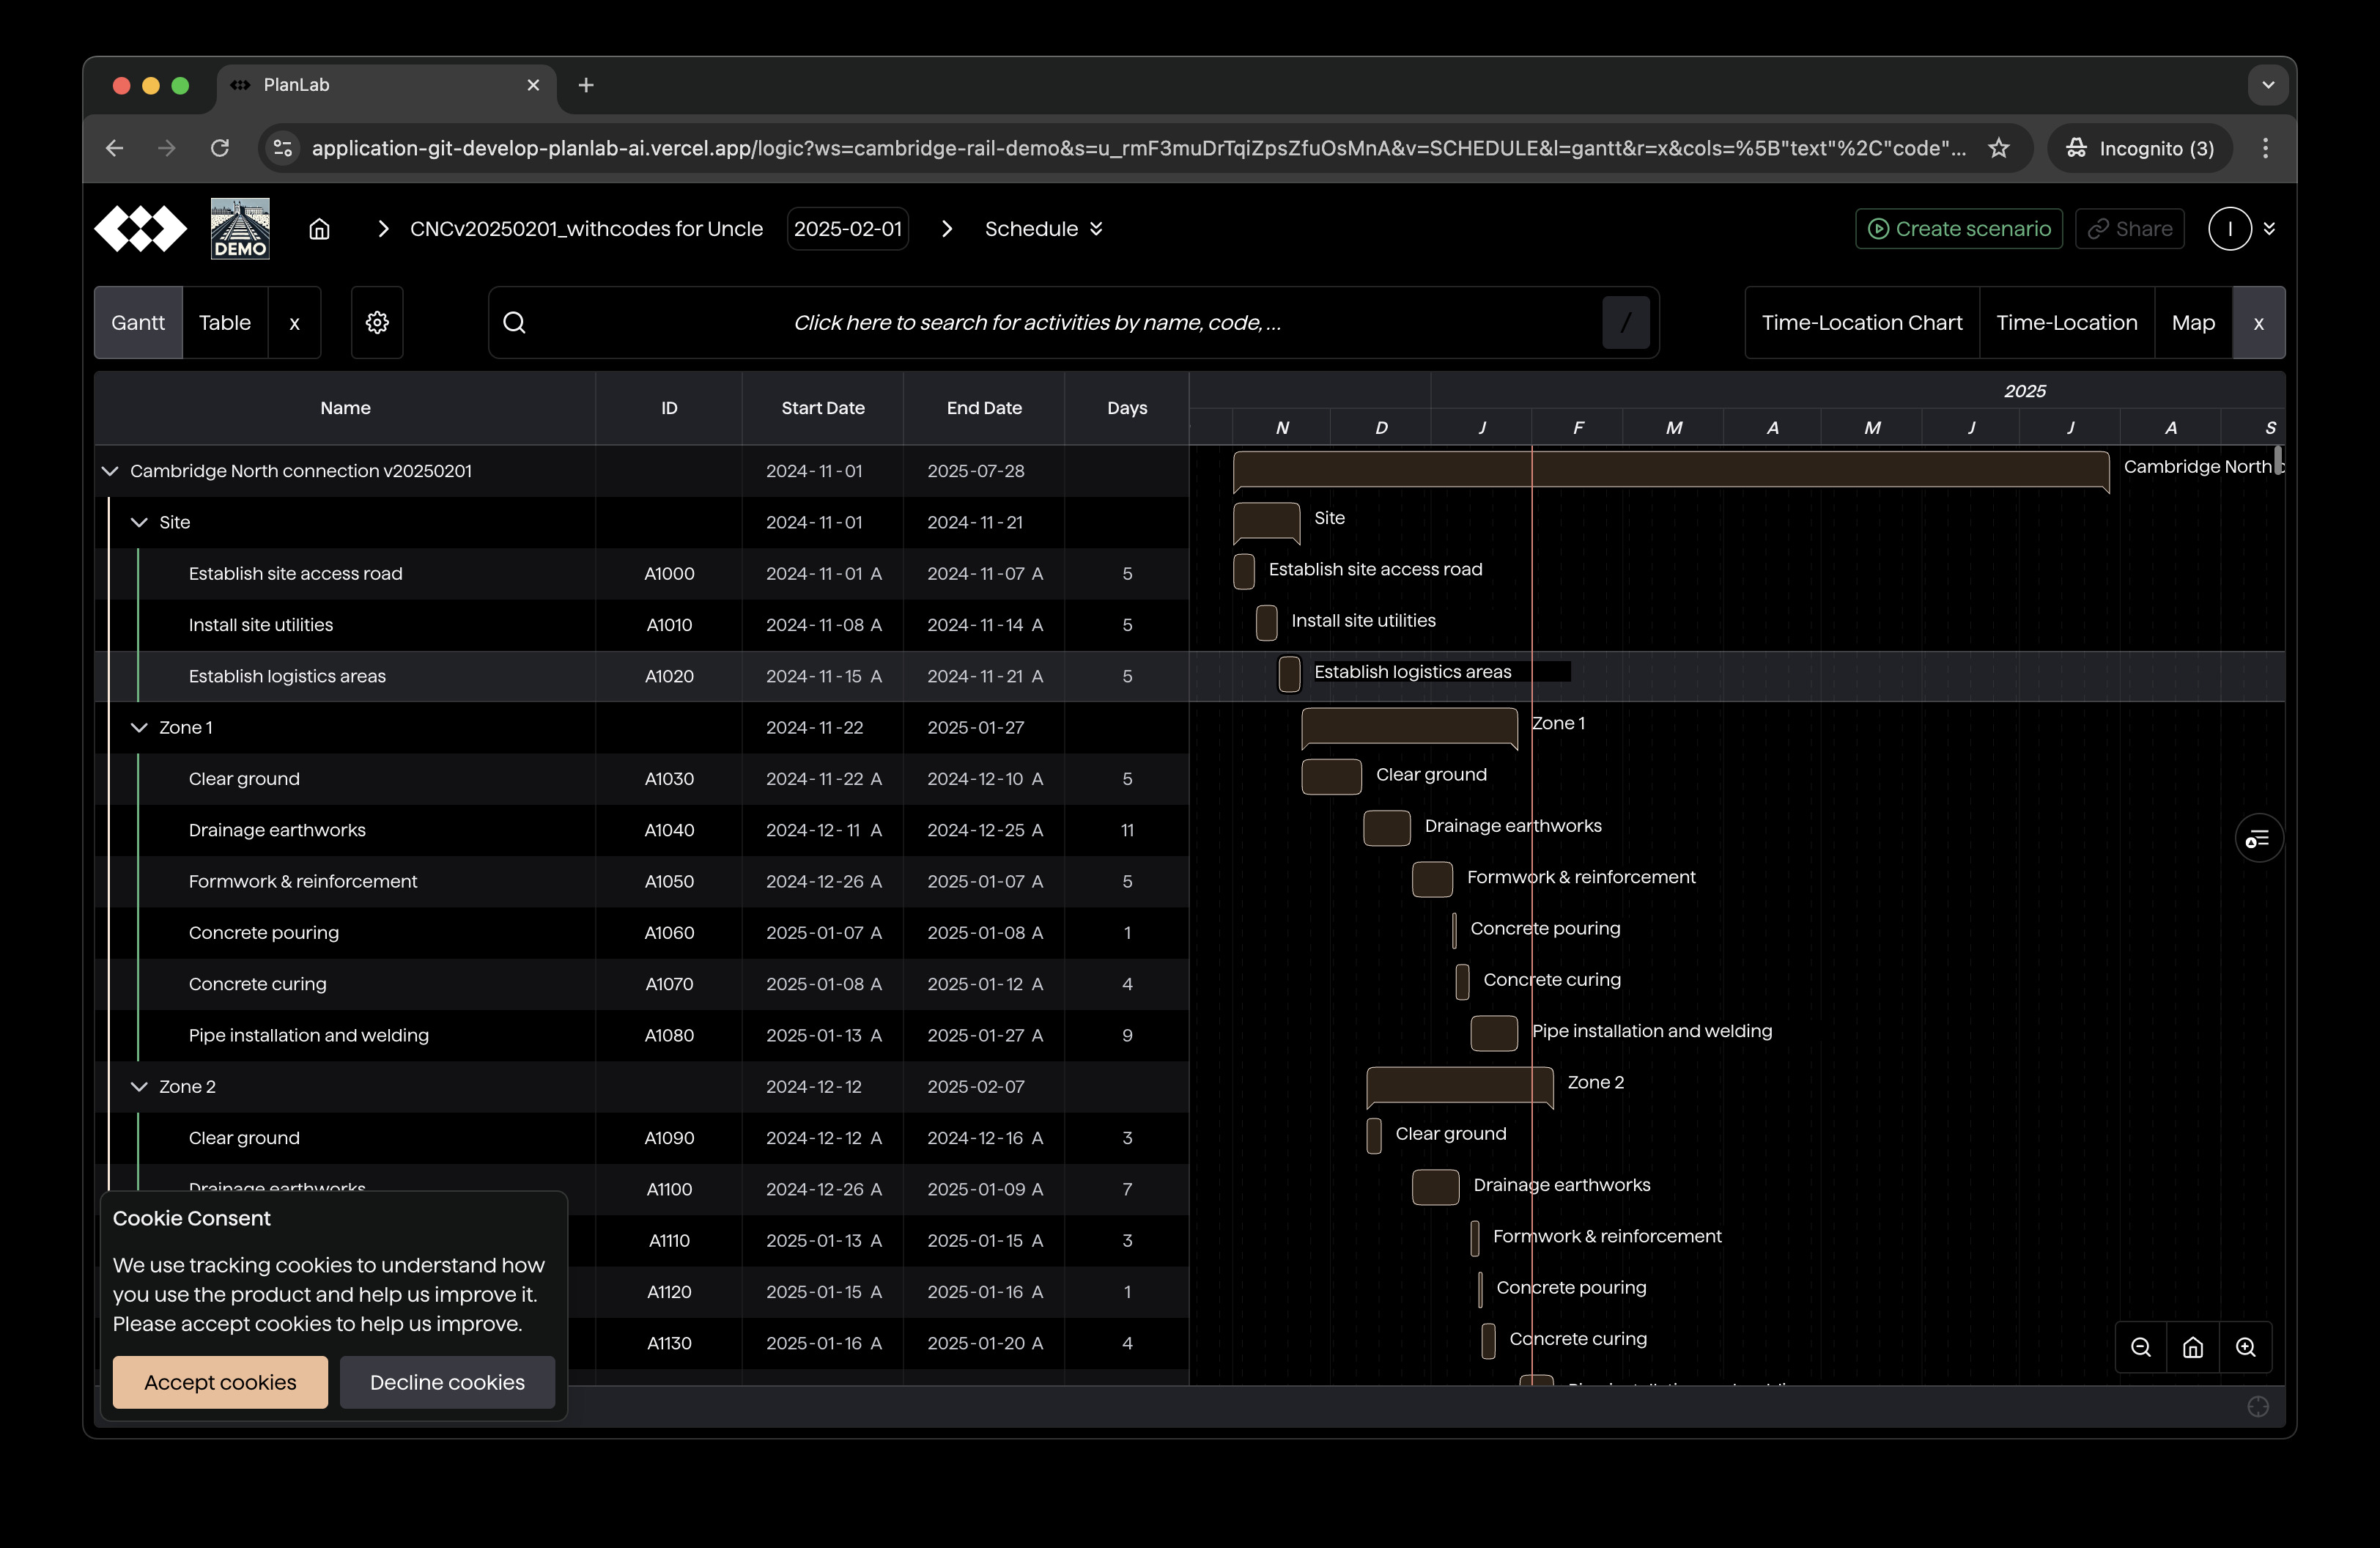
Generation 4: GridChart
GridChart, the current generation of schedule viewer, is a rewrite of BarChartTable. It builds on three ideas:
- The realisation that as a planning company, we only want to render tables of a few types of schedule data (activities, activity codes, resources, calendars, etc.), and they are similar enough. We can enumerate how to render them, simplify data flow, and reduce unnecessary re-rendering.
- In-place editing should be a first-class citizen, not an add-on.
- Data should in general be fetched from and dispatched to the central Redux store, as deep in the component tree as possible (to avoid unnecessary re-rendering near the root).
It re-renders much less and replaces BarChartTable over a few months.
The problem is, when the schedule reaches 10,000 activities or more, computation becomes long enough to freeze the UI for more than a second. In other words, rendering once takes seconds to finish.
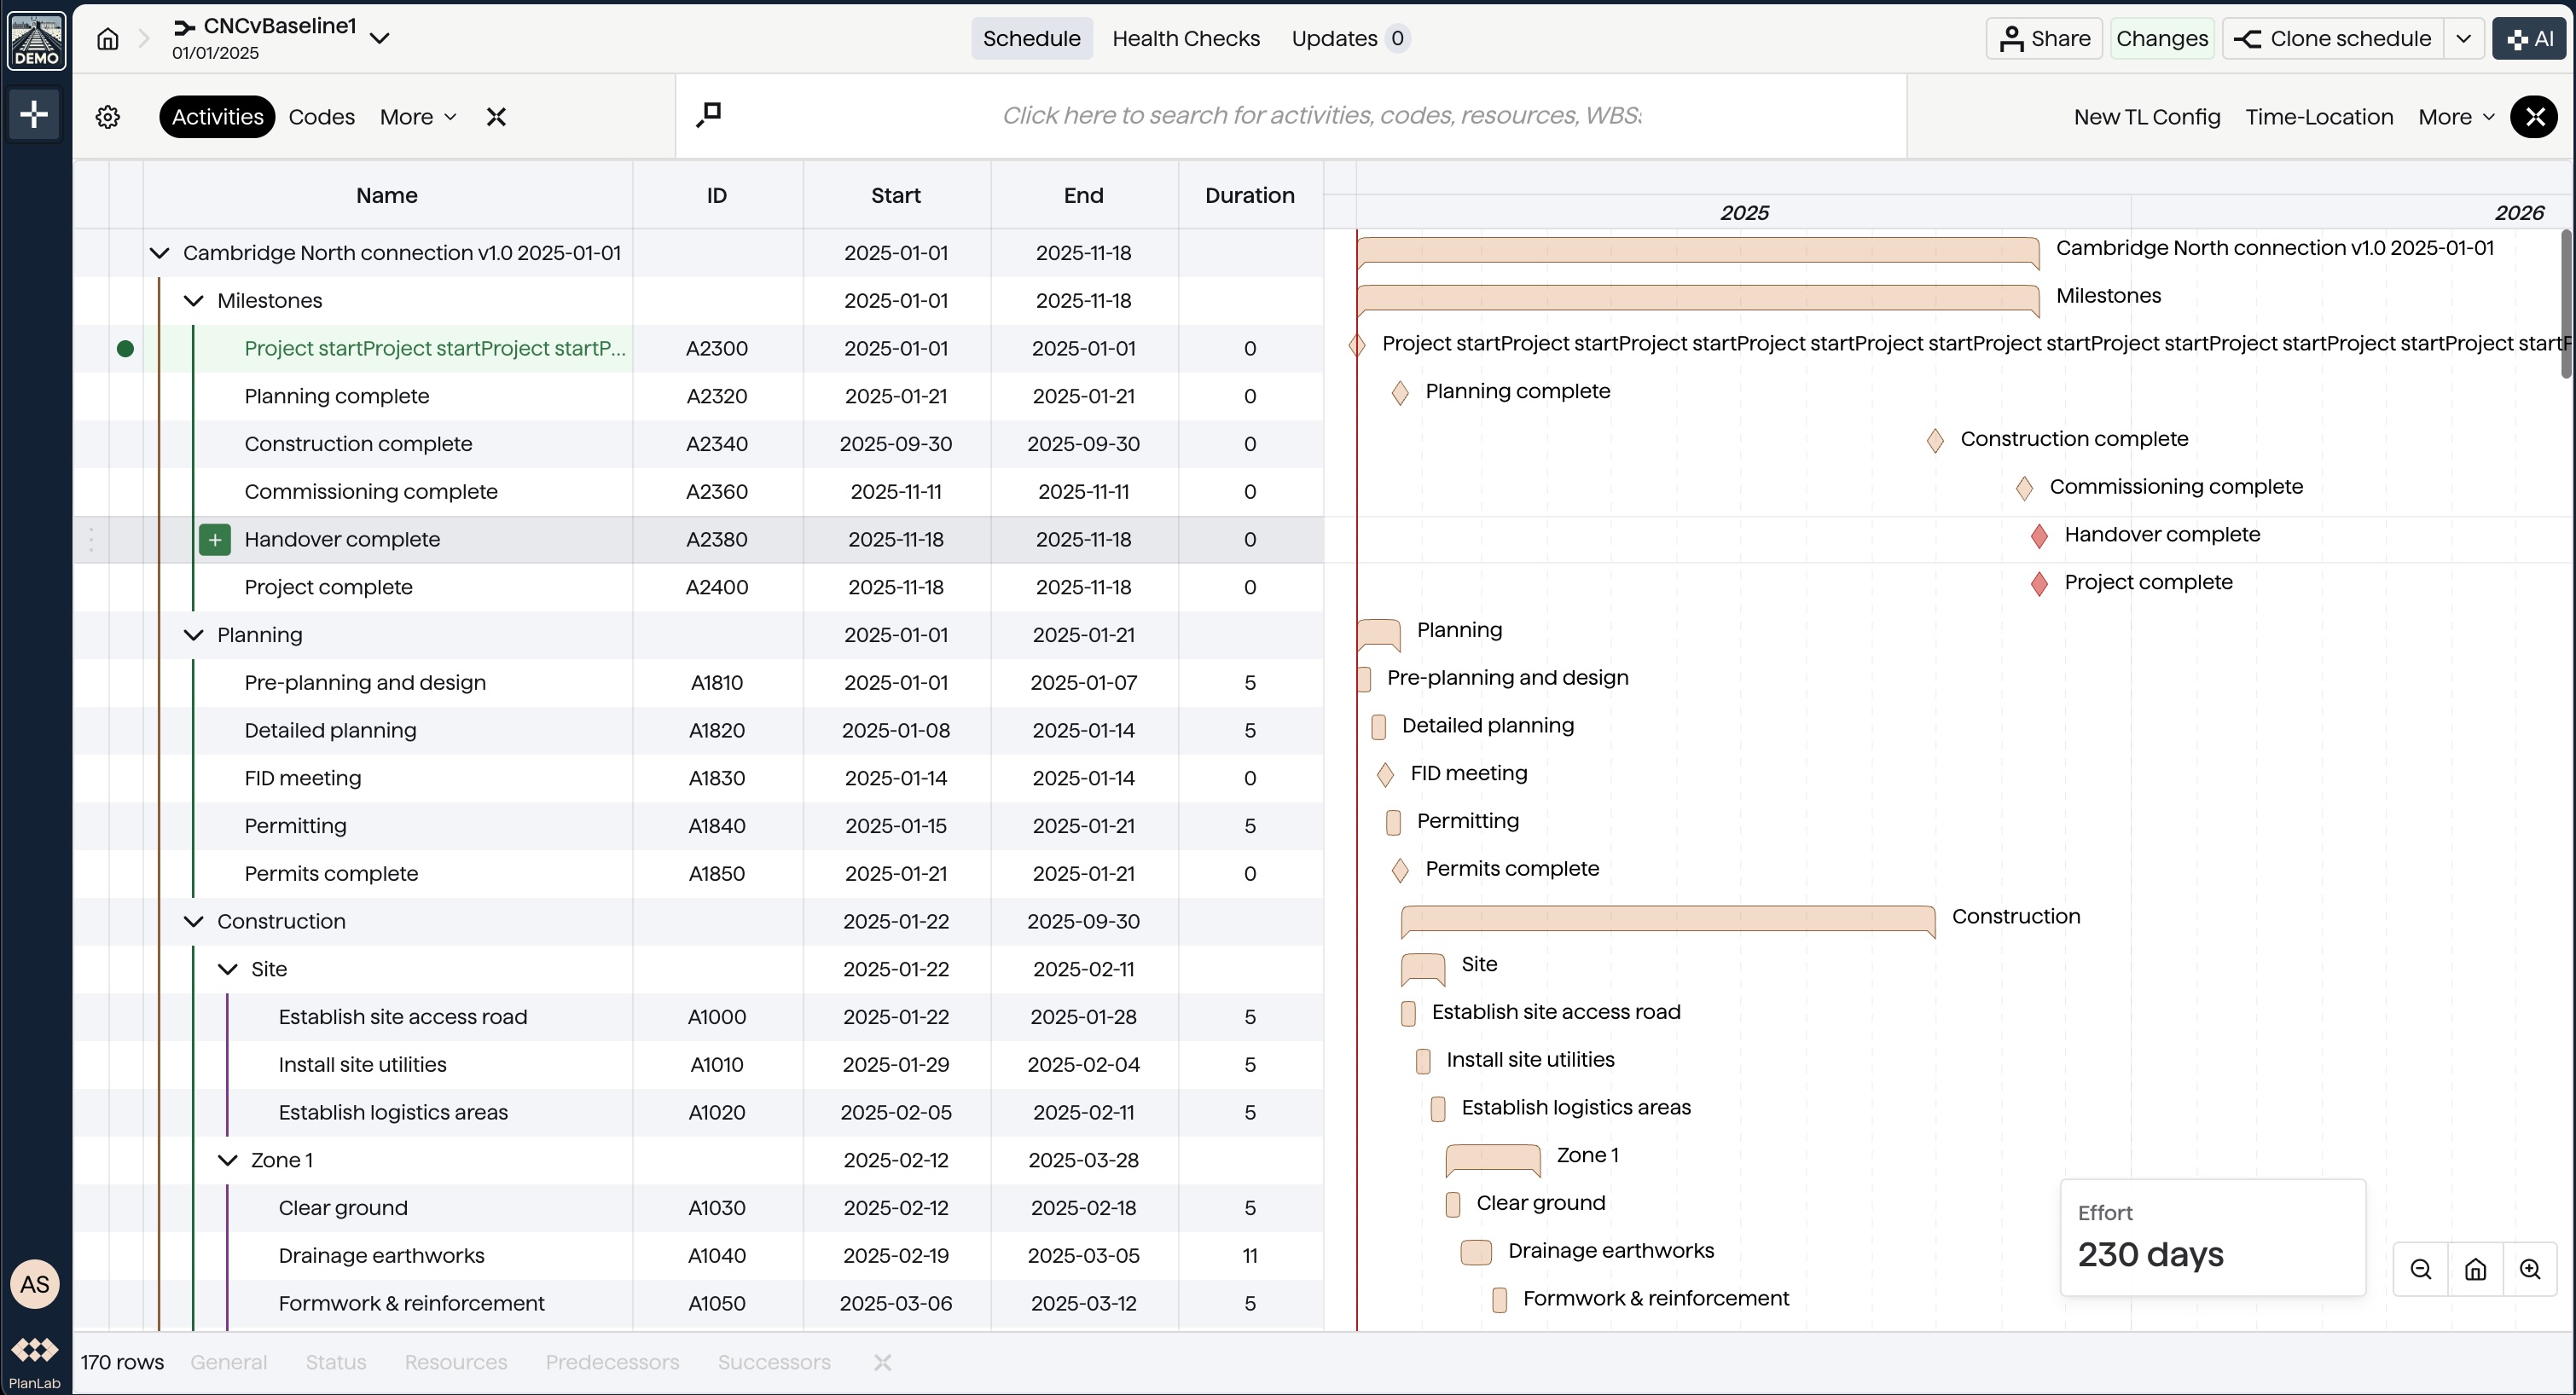
Generation 5: SchedulePlanner
SchedulePlanner is our next generation of schedule editor, which manages to open and edit XERs with 1 million rows during our internal tests. Here are the design choices that made this possible.
Particularisation
Instead of rendering any schedule data (activities, calendars, resources etc.), it's designed to only render WBSs and activities. With this particularisation, it's easier for us to move around and break apart computations to prevent noticeable UI freezes.
Lazy Computation
Our frontend is primarily React.js and Redux. Traditionally, React encourages data-driven rendering. But for large schedules, it's slow to compute all the data ready first. What we did instead is to delay computation as late as the cell that needs the data renders.
For example, the "Change" column shows changes to activity start and end dates in an activity compared to the corresponding activity in the baseline.
In the generation 4 (current) schedule viewer, we compute date changes of all activities and feed the data to the render component, who decides on what to show. In a schedule with 1 million activities, that's 2 million change computations and 2 million activity matches per render.
In the next generation schedule viewer, we only compute the changes when the cell is shown. If the "Change" column is turned off, we do not compute changes at all. Even when the column is turned on, we only compute changes for activities in the viewport (about 30 of them, depending on the size of the browser window).
Multi-Threading Global Computations
Though we adopt render-driven computation, some expensive computation is needed for most rows and it's awkward for each row to compute it themselves when they render. One prime example is re-scheduling (usually via Critical Path Method, or "CPM", or our resource-aware re-scheduling algorithms such as AIRL).
One way Planlab differs from Oracle P6 is that Planlab always reschedules the project when changes are made: users never "forget" to reschedule or leave the project in an inconsistent state. That means we need to run CPM whenever activities, dependencies, or calendars change.
The problem is for large schedules, CPM may take more than a second, even after it is heavily optimised. As the browser by default runs all JavaScript computation in the main thread, when CPM is being carried out, the UI is frozen as the code responsible for handling user interactions cannot be run.
What we do instead is to move the computation to another thread (i.e. Web Worker). Surprisingly, there is a trade-off here as well, as sharing data between threads is non-trivial. It usually requires copying the data, but copying a lot of data itself takes time and more importantly also freezes the UI.
The End of Optimisation and the Last Rewrite
Most schedules we receive from clients are well within 10 thousand rows.
What's the point of making the editor fast enough for a schedule 100 times that?
Well, what we did before was to optimise the component until it's fast enough for the schedules at hand. Of course we could have aimed for 100K rows this time. But then a year or two down the road, we may have to optimise again because a 500K-rows schedule comes up.
People say premature optimisation is the root of all evil but Will we still be able to pull off a major optimisation a year or two later? Maybe not. It's getting harder and harder to optimise the editor due to the added features and custom logics for clients. Additionally, a year or two down the road, we may be focusing on scaling and can no longer find the resources to rewrite a core component like this. For this reason, we pushed to the extreme and make sure the schedule viewer component can extend without further rewrites or restructuring of computation.
So What's Next?
We will be releasing the new schedule editor in the coming weeks. If you need it urgently, get in touch or talk to your point of contact at Planlab.
Follow our LinkedIn for our latest development in transforming project control with technology!